
 Print
Print
|
|
|
Performing Tabular Analysis
You can create a cross tab table to analyze an audience.
- Click Cross Tabs.
- Select whether to show values or percentages.
- Select the dimension to appear in rows.
- Select the dimension to appear in columns.
- Click Add Table.
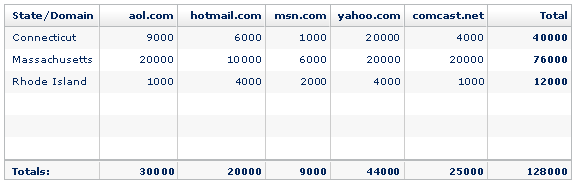
The rows of the table contain the results of the query. The columns contain all possible values.
Print