
 Print
Print
|
|
|
Modifying a Chart
You can change the title, type, data that is represented in the chart, the size of the chart, and whether to display numeric or percentage values in the chart.
To modify the chart:
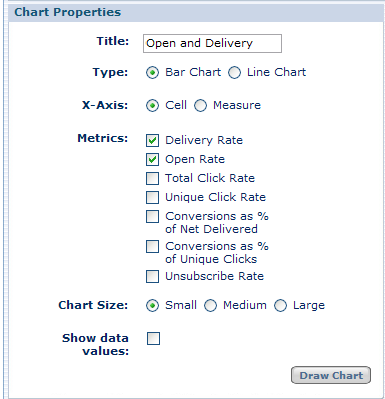
- Use the controls in the Chart Properties pane.
You adjust chart properties, such as adding a title, specifying bar chart vs. line chart, selecting measures to display, adjusting chart size, and choosing whether or not to display data values. The choices within the Chart Properties pane change depending on whether you have selected a bar chart or a line chart, and on whether you are in View Percent or View Count mode.
If you select Bar Chart, the choices for the X-Axis are:
- Mailing (or Cell, Audience, Link, or Format – whatever the lowest level of data is on the report you chose prior to selecting View Chart)
- Measure. Selecting Mailing (or Cell, Audience, etc.) places the Mailing names on the X-Axis (horizontal axis), and places the selected measures in the chart legend, so that all measures for a given mailing are grouped together on the chart. Selecting Measure places the Measures on the horizontal axis and the Mailing names in the chart legend, so that it is easier to compare performance across mailings for a given measure.
If you select Line Chart, the choices for the X-Axis are:
- Mailing (or Cell, Audience, Link, or Format)
- Measure
- Dates
- View percentages or counts.
As when you are viewing campaign results in a table, you can toggle between count measures and percent measures by clicking on View Counts or View Percent above the chart.
- To change the level being graphed, select a different report using the Report Navigator. The lowest level on the report you choose is the data that is displayed in the chart.
- Click Draw Chart.
Print