![]()
![]()


|
|
|
|
|
|
The EXPLAIN command outputs the query plan.
Syntax
EXPLAIN { SELECT... | INSERT... | UPDATE... }
Output
The EXPLAIN command is provided as a support feature and is not fully described here. For information on how to interpret the output, contact Technical Support.
Vertica QUERY PLAN DESCRIPTION:
------------------------------
ID:1 Cost:2.7 Card:-1
Projection: P0
ID:2 Cost:0.1 Card:-1
DS: Value Idx
ProjCol:c_state, Table Oid.Attr#:25424.4
Pred: Y Out: P
ID:3 Cost:0.3 Card:-1
DS: Position Filtered by ID:2
ProjCol:c_gender, Table Oid.Attr#:25424.2
Pred: Y Out: P
ID:4 Cost:0.3 Card:-1
DS: Position Filtered by ID:3
ProjCol:c_name, Table Oid.Attr#:25424.3
Pred: Y Out: P
ID:5 Cost:1 Card:-1
DS: Position Filtered by ID:4
ProjCol:c_cid, Table Oid.Attr#:25424.1
Pred: N Out: V
ID:6 Cost:1 Card:-1
DS: Position Filtered by ID:4
ProjCol:c_state, Table Oid.Attr#:25424.4
Pred: N Out: V
yum -y install graphviz
A example of a GraphViz graph for a Vertica plan:
digraph G {
graph [rankdir=BT]
0[label="Root"];
1[label="ValExpNode"];
2[label="VDS:DVIDX(P0.c_state)"];
3[label="PDS(P0.c_gender)"];
4[label="PDS(P0.c_name)"];
5[label="Copy"];
6[label="PDS(P0.c_cid)"];
7[label="PDS(P0.c_state)"];
1->0 [label="V"];
1->0 [label="V"];
2->3 [label="P"];
3->4 [label="P"];
4->5 [label="P"];
5->6 [label="P"];
5->7 [label="P"];
6->1 [label="P+V"];
7->1 [label="P+V"]; }
Example:
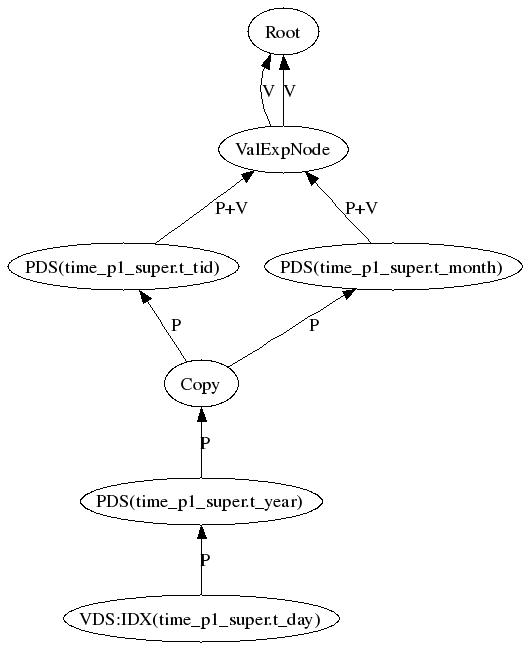
GraphViz Information